Reports #
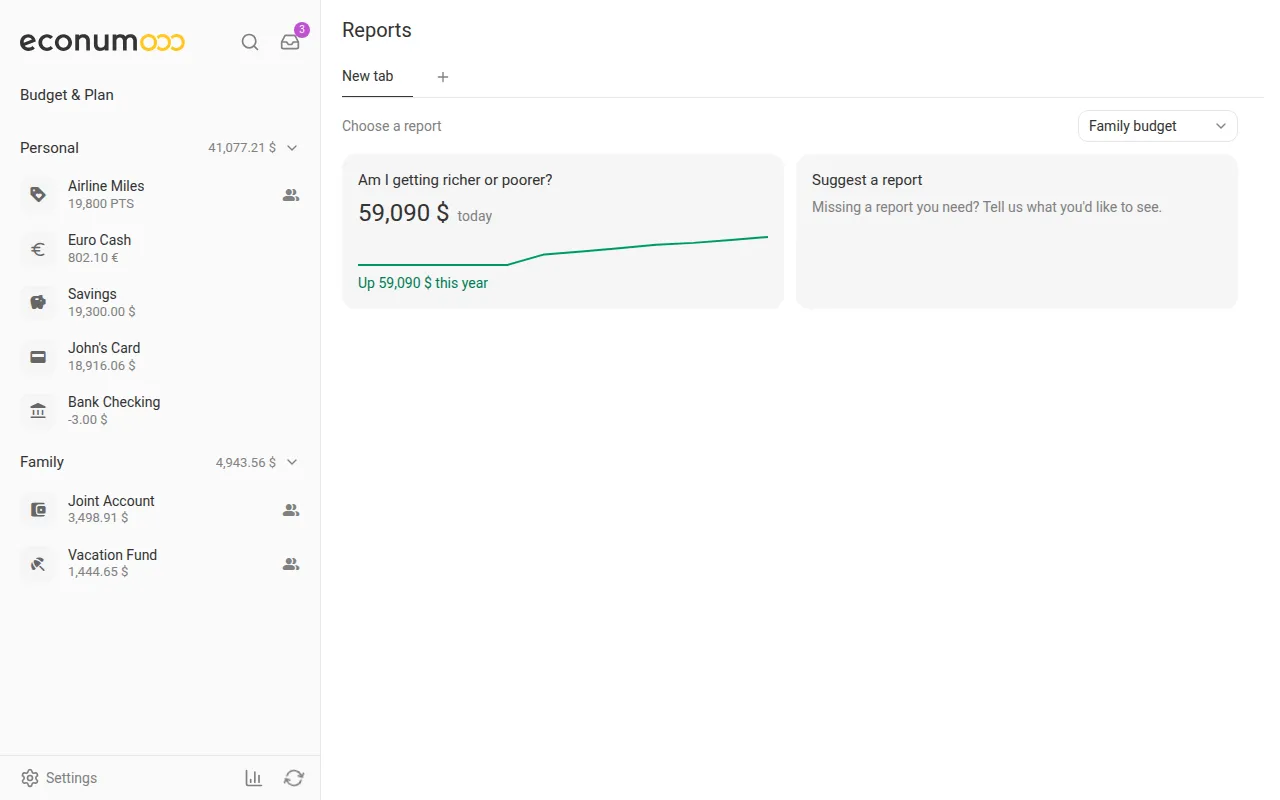
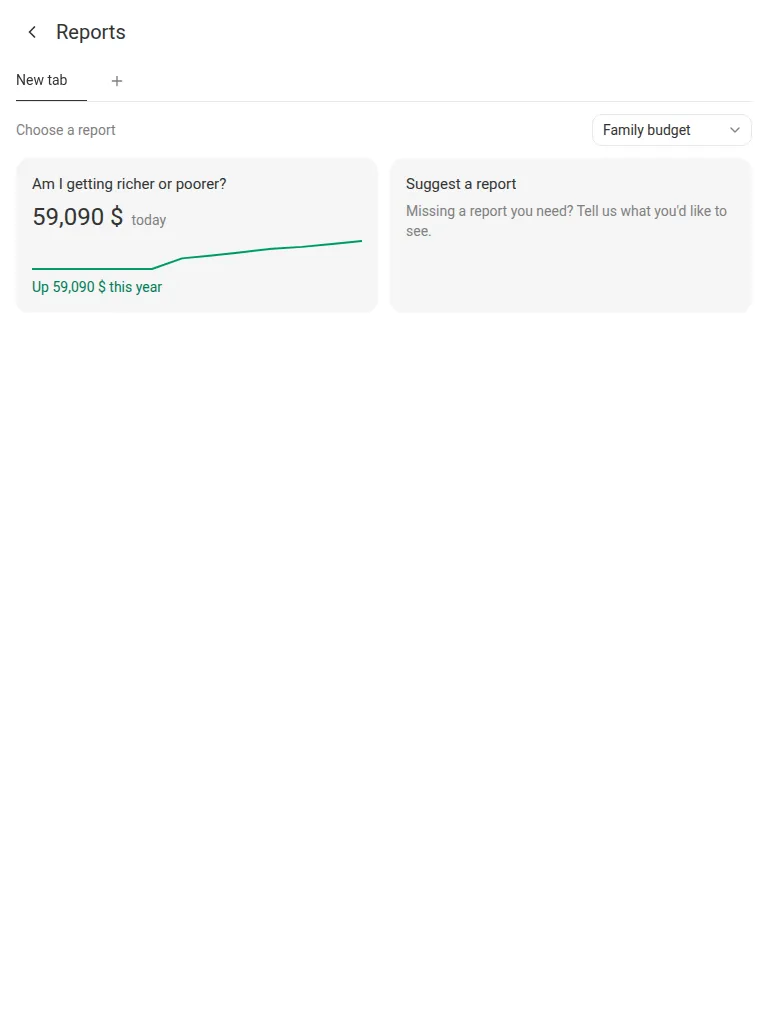
Reports answer bigger questions than a single month’s budget. Open them with the chart icon at the bottom of the sidebar, next to the sync button (on mobile, at the bottom of the home screen).
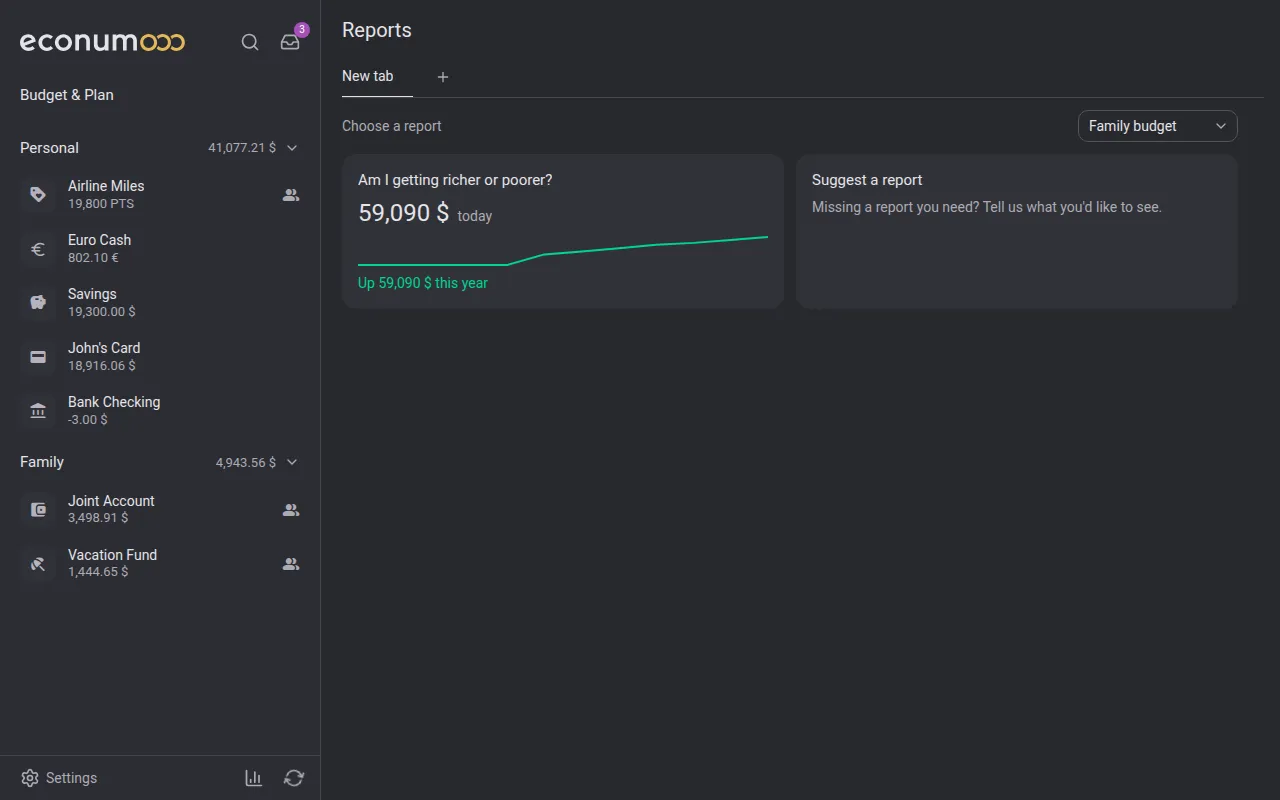
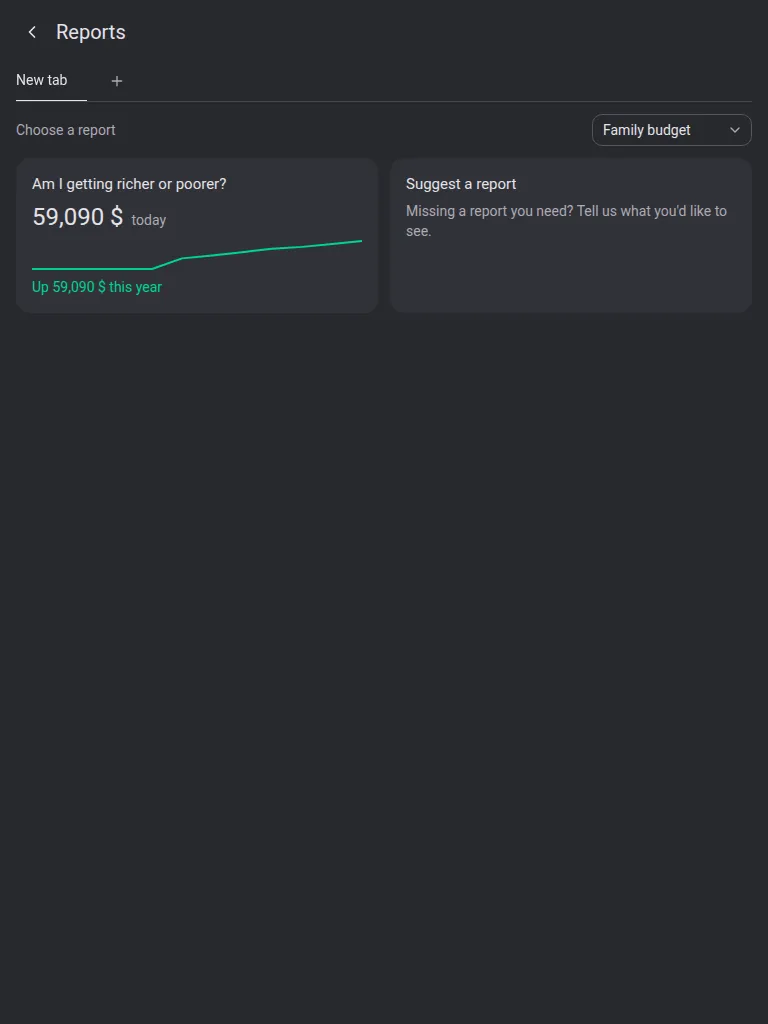
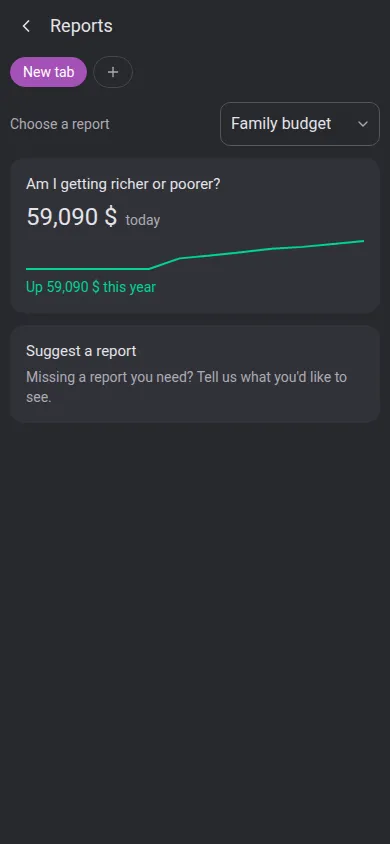
The first screen is a list of reports to choose from. The picker in its top-right corner sets the scope: My accounts, or one of your budgets — a shared budget covers everyone taking part in it. Each report card previews its answer; Net worth shows today’s total and how much it changed this year.

In this section #
Net worth #
Net worth answers “Am I getting richer or poorer?”. It draws one line for the total of your accounts over time, with the change for the period underneath. Pick the period with 1y, 3y or All — All starts at your first transaction.
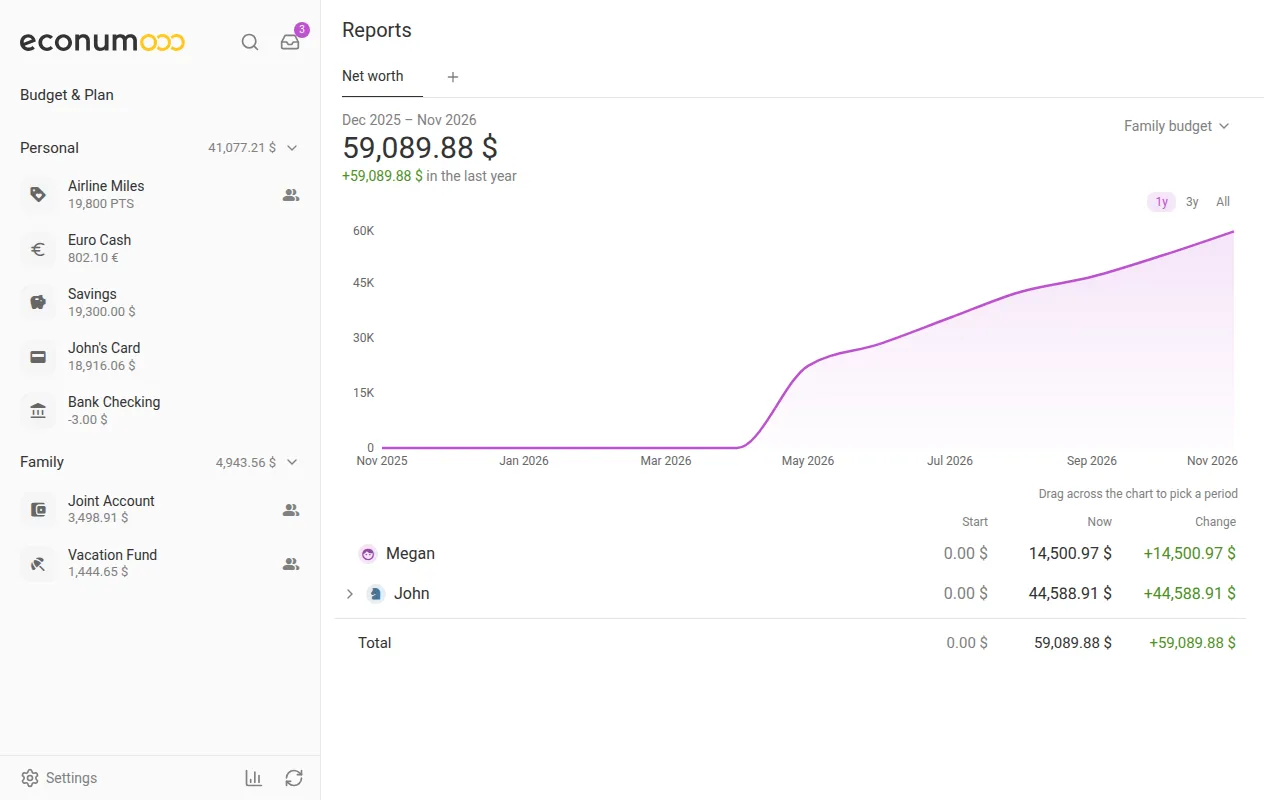
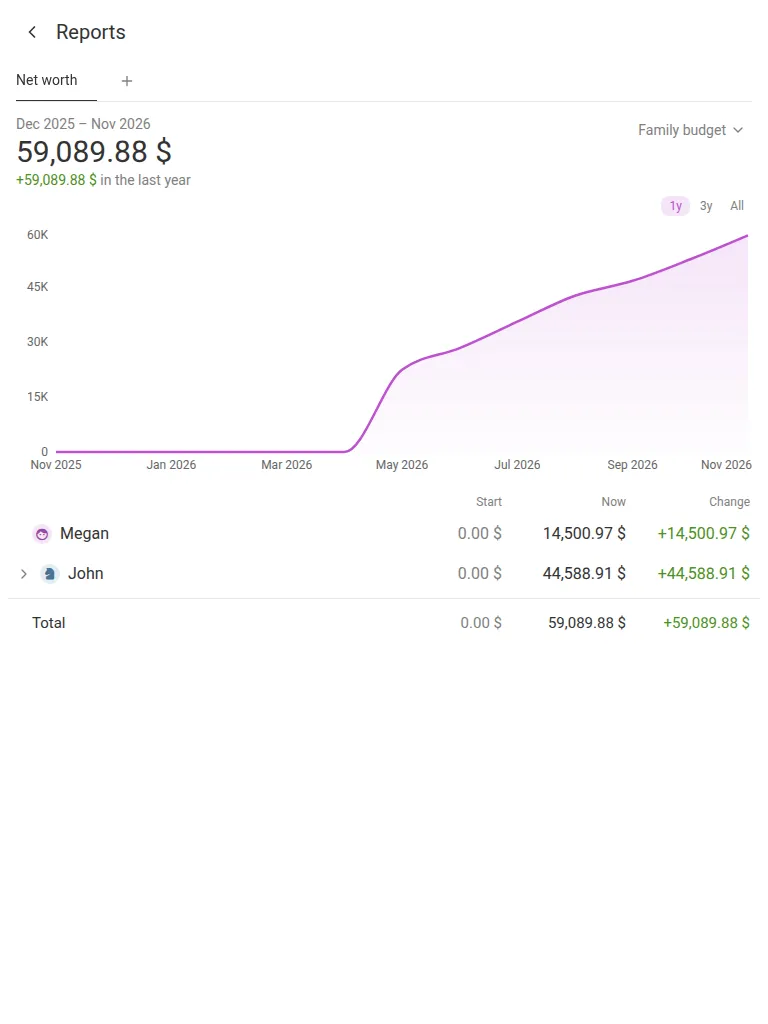
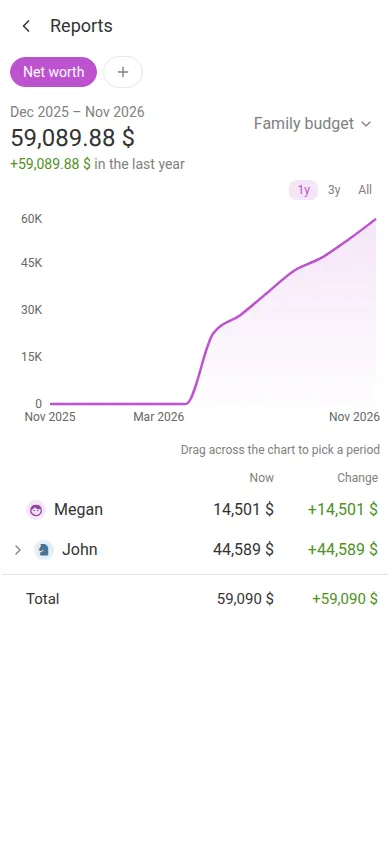
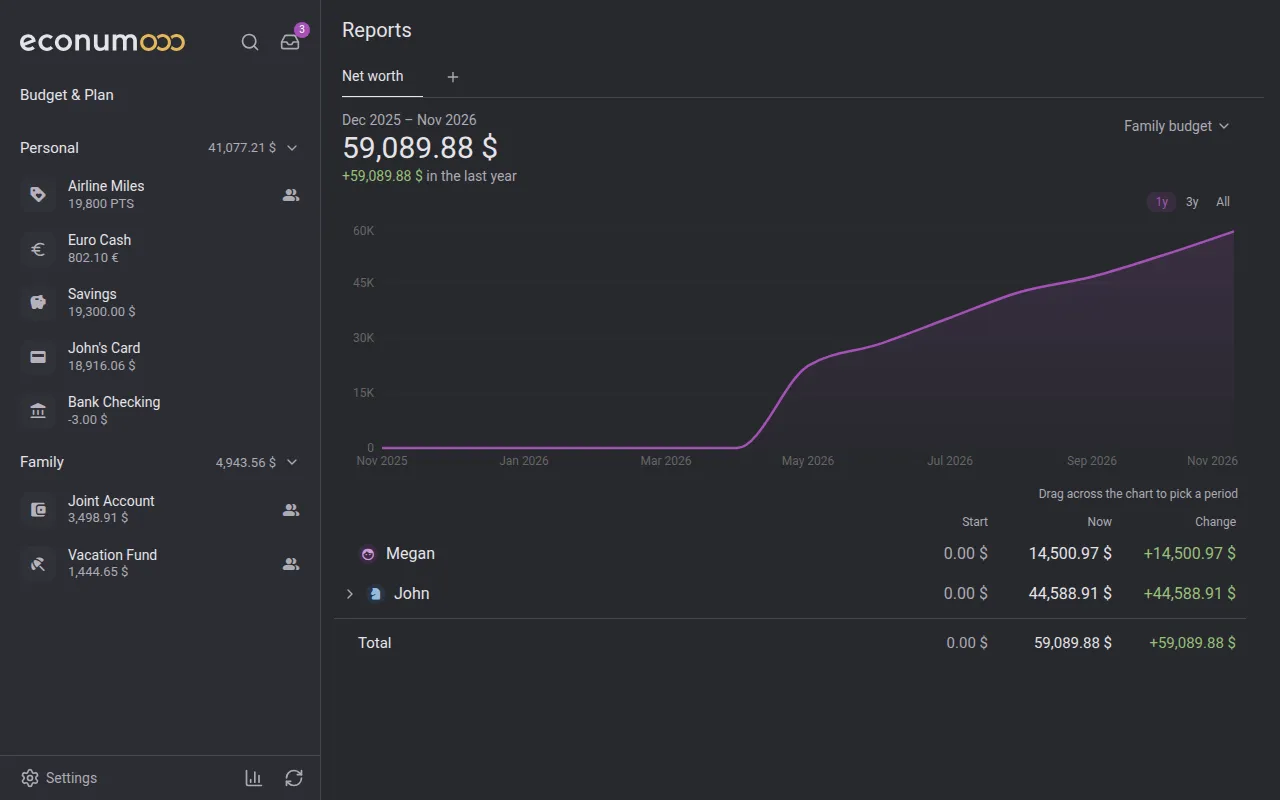
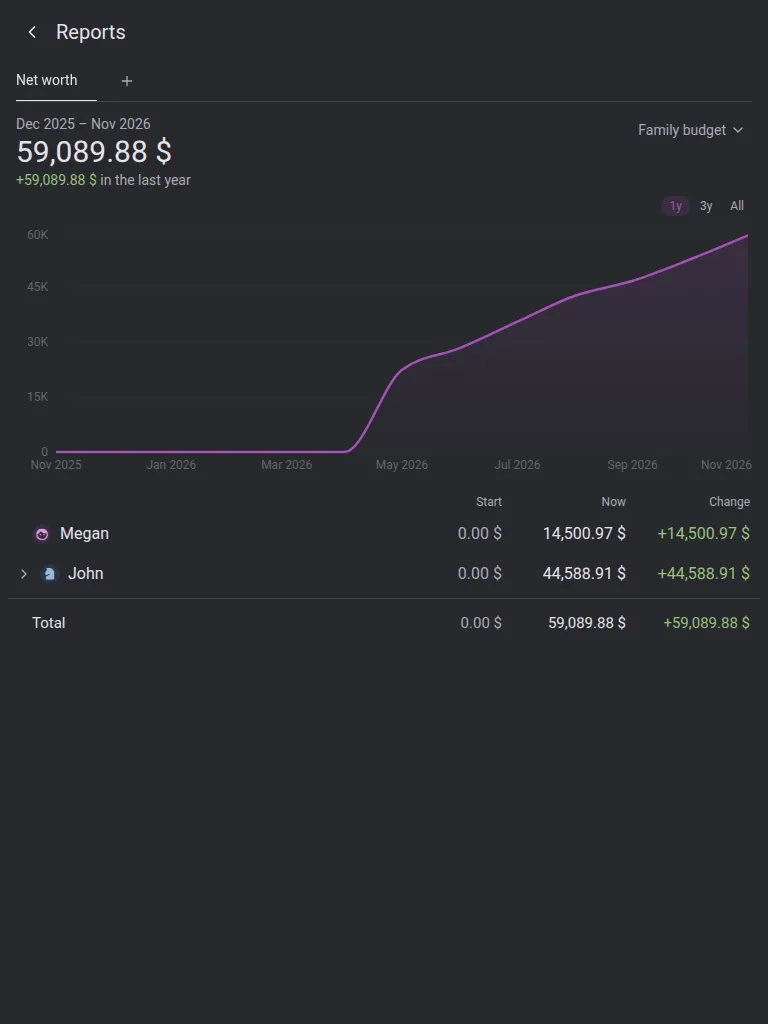
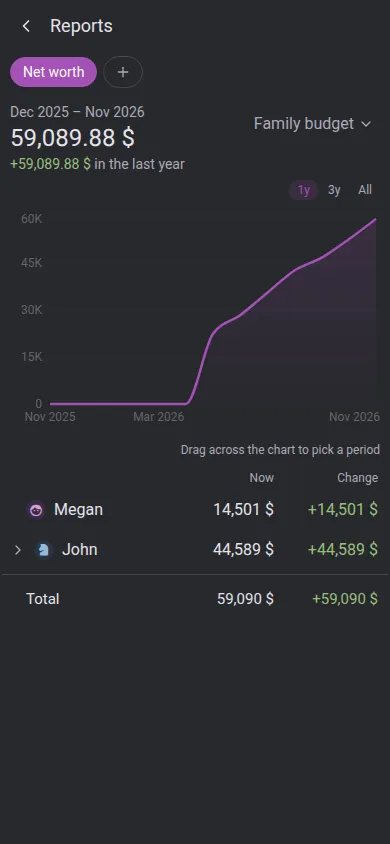
The table under the chart shows where the change came from, with Start, Now and Change columns:
- For My accounts, one row per account folder; open a folder to see its accounts.
- For a budget, one row per person taking part in it. Open a row to see that person’s savings accounts by name, plus one Everyday accounts total for the rest. Another person’s accounts that aren’t shared with you are never listed one by one — only their total.
Select an account row to list its transactions.
To look at a shorter stretch, drag across the chart. The figures follow your selection, which replaces the period buttons, and a Transactions button lists what happened in that range.
Note Deleted accounts are left out of the report completely, including their history.
Report tabs #
Reports open in tabs at the top of the page, so you can keep several open side by side — for example, net worth for your own accounts in one tab and for the family budget in another. + opens a new tab with the report list. A tab’s menu can rename, duplicate or close it. Tabs are remembered on the device you use.
Suggest a report #
Missing a report you need? The Suggest a report card opens the feedback form with Feature request already chosen. Tell us what you’d like to see.