At its heart, the difference between your budget vs actual is simple: the budget is the financial plan you hope to follow, and the actuals are what really happened.
Think of it like planning a road trip. Your budget is the map—the route you’ve planned, the estimated gas money, the hotels you’ve picked out. Your actuals are the journey itself, complete with the unexpected detour, the surprise tourist trap, and the amazing roadside diner you hadn’t planned for. Comparing the two is the only way to know if you’re on track.

What Is a Budget vs Actual Analysis? #
A budget vs actual analysis is the process of putting your planned income and spending right next to what you actually earned and spent over a certain time. This isn’t just for big companies. It’s one of the most powerful financial health checks for any person or family who’s serious about getting their money under control.
Your budget sets the ground rules and gives every dollar a job. Your actuals, on the other hand, show where your money really went.
The whole point is to uncover the truth about your spending habits. When you put the plan next to reality, you immediately see the differences, which we call “variances.” These variances tell a story. Maybe it’s a forgotten subscription quietly nibbling at your bank account, or maybe you’re always overspending on groceries. This is the first step to plugging financial leaks and making smarter decisions that line up with what you truly want.
Your Budget Plan vs. Your Financial Reality #
Getting a handle on the unique roles of your budget and your actuals is crucial. A budget is always looking forward; it’s proactive and built on goals and educated guesses. In contrast, your actuals are historical facts—they’re reactive and made up of real, concrete transaction data. You can dive deeper into tracking this data in our guide on managing your income and expenses.
This comparison isn’t about feeling guilty about past spending. It’s about gathering intel to build a smarter, more realistic financial future. Every variance, good or bad, is a chance to learn.
To really nail down these ideas, let’s look at the core differences.
Key Differences Between a Budget and Actuals #
This table breaks it down clearly, showing how the plan and the reality serve different purposes.
| Aspect | Budget (The Plan) | Actual (The Reality) |
|---|---|---|
| Purpose | To set financial goals and allocate resources for the future. | To record historical financial transactions as they happen. |
| Timing | Created before a financial period begins (e.g., monthly, quarterly). | Recorded during and after a financial period has passed. |
| Nature | A proactive, forward-looking estimate or forecast. | A reactive, backward-looking record of facts. |
| Data Source | Based on past performance, assumptions, and future goals. | Derived from actual bank statements, receipts, and transactions. |
In the end, running a budget vs actual analysis turns vague financial goals into concrete, actionable steps. It gives you the clarity you need to adjust your course and confidently steer your financial life in the right direction.
Why This Comparison Can Radically Improve Your Finances #
Knowing what a budget vs actual analysis is one thing, but really getting why it’s so critical is where the magic happens. This simple habit of checking your plan against reality does more than just make you good at math; it changes your entire relationship with money. It builds awareness and gives you the hard data you need to make better decisions.
For households and families trying to manage money together, this practice is a game-changer. It creates total transparency. When everyone can see where the money was supposed to go versus where it actually went, money talks become a team effort, not a blame game. You start solving problems together.
Uncovering Those Sneaky Spending Habits #
Right away, you’ll start to see the subtle but expensive patterns that usually fly under the radar. Think of these as the small, slow leaks that can sink your financial goals over time.
- Ghost Subscriptions: You might finally spot that $15 monthly charge for a streaming service you forgot you even had.
- The Daily Coffee: That $5 coffee doesn’t feel like much each day, but your variance report will flag it for what it is: a $150 monthly expense.
- Grocery Store Creep: A few impulse buys each trip can easily turn a $600 food budget into an $800 reality.
Once you see these numbers laid out, you’re back in the driver’s seat. You get to make conscious choices instead of letting autopilot spending run your life. For small businesses, this same discipline is crucial to stop burning cash, which is why many bring in professional CFO services for small business to get a handle on their spending.
This isn’t about feeling restricted. It’s about gaining awareness. It’s about having the right information to make sure your money is actually going toward the things you care about.
Shifting from Hindsight to Foresight #
Looking back at how you did is the only way to create a smarter plan for the future. If you notice you’ve overspent on groceries by 15% for three months straight, that’s not a fluke—it’s a trend. That insight gives you two clear choices: either adjust your future grocery budget to be more realistic or find ways to change your shopping habits.
This is a universal challenge. Even governments face it on a massive scale. During the COVID-19 pandemic, for example, there was a huge gap between planned budgets and actual spending. In 2023, general government expenditures in OECD countries averaged 42.6% of GDP, a drop from the 48.3% peak in 2020. That mirrors how families often see their actual spending on variable costs jump 20-30% over budget during unexpected life events. You can explore more on government spending on oecd.org.
Ultimately, comparing your budget to your actual spending turns hindsight into foresight. It helps you build a financial plan based on your real life, not just wishful thinking, and that’s how you set yourself up for long-term success.
How to Calculate and Understand Budget Variance #
Once you have your budget set and your actual spending numbers in hand, the real work begins. The next step is figuring out the difference between the two, a gap known as budget variance. This isn’t just about crunching numbers; it’s about turning that raw data into genuine financial insights.
Think of it as the process of discovering where your plan held up and where it fell short. This simple comparison tells a powerful story about your financial habits and shines a light on the path from accountability to smarter, more intentional decisions with your money.
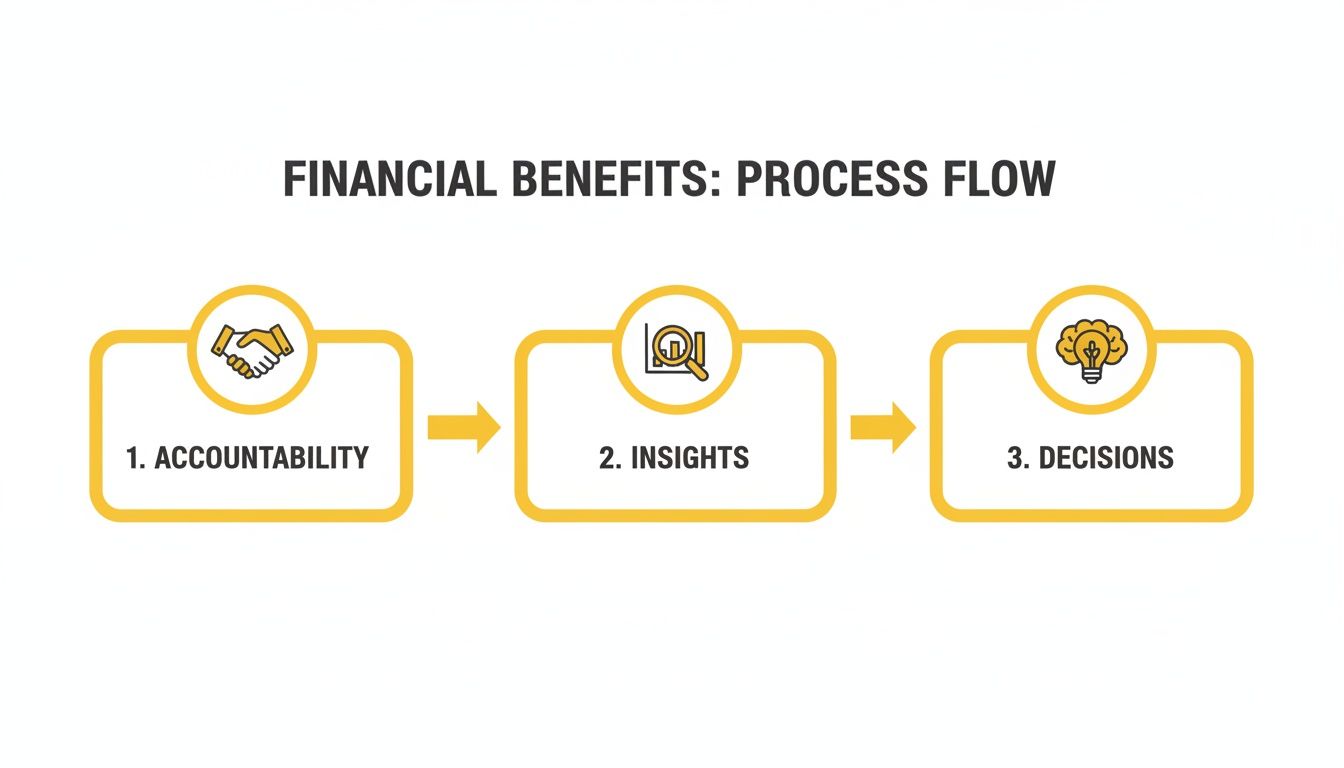
As you can see, tracking your finances creates a feedback loop. It builds accountability, which generates the insights you need to make better choices.
Calculating Absolute Variance #
The most direct way to measure the difference is with absolute variance. This is simply the raw dollar amount separating what you planned to spend from what you actually spent.
The formula couldn’t be simpler: Absolute Variance = Budgeted Amount – Actual Amount
Let’s walk through an example. Say you budgeted $150 for your electricity bill this month. When the bill arrives, the actual cost is $175.
Your calculation looks like this: $150 (Budget) – $175 (Actual) = -$25
That -$25 is your absolute variance. It’s a clean, straightforward number telling you exactly how much you went over budget.
Calculating Percentage Variance #
While knowing the dollar amount is essential, percentage variance adds crucial context. It shows you how significant that difference really is in relation to the original budget.
Here’s the formula: Percentage Variance = (Absolute Variance / Budgeted Amount) x 100
Sticking with our electricity bill: (-$25 / $150) x 100 = -16.7%
Now you see the full picture: you overspent by nearly 17% on electricity. A $25 overage on a $1,000 mortgage payment is barely a blip, but on a $150 utility budget, it’s a much more meaningful deviation.
Key Insight: Using both absolute and percentage variance gives you a complete story. One shows the direct impact on your cash flow, while the other reveals how far off your plan was.
Interpreting Your Variances #
Getting the numbers is just step one. The real value comes from understanding what they’re trying to tell you.
- Favorable Variance: This is when things go better than planned. For expenses, it means you spent less than you budgeted (a positive number). For income, it means you earned more.
- Unfavorable Variance: This is when your results are worse than your budget. For expenses, you spent more than you planned (a negative number). For income, you earned less.
Even massive organizations deal with this. The US Congressional Budget Office, for example, initially projected $4.0 trillion in mandatory spending for the 2025 fiscal year. Revised estimates now place that figure closer to $4.2 trillion—a 4% unfavorable variance. You can dig into these fiscal projections from the CBO for more detail. If a government budget can be off by hundreds of billions, it’s perfectly normal for our personal budgets to miss the mark on flexible categories like groceries or gas.
By consistently calculating your variances, you can spot small leaks before they turn into major floods. A single unfavorable variance might just be a one-off event. But if you see the same category over budget for three months straight, you’ve identified a pattern. That’s the kind of data that helps you build a more realistic and resilient financial plan for the long haul.
Putting It All to the Test: Real-World Budget vs Actual Scenarios #
Knowing the theory is one thing, but seeing how a budget vs actual analysis plays out in real life is where it all starts to make sense. Let’s move beyond the formulas and dive into a few common situations to see how this simple comparison can help you, your partner, or your family take back control of your finances.
The real magic happens when you turn a spreadsheet of raw numbers into a clear story about your spending habits. By looking at different timeframes and tackling specific challenges, you’ll uncover insights that can lead to real, lasting change.
Scenario 1: The Monthly Check-In for an Individual #
Meet Alex. Alex is trying to get a handle on impulse spending, and the best way to stay accountable is a quick review at the end of each month.
Here’s a snapshot of what Alex’s report for April looks like.
Sample Monthly Household Budget vs Actual Report
This table offers a simplified look at how a monthly budget vs actual analysis works. It quickly flags which spending categories are on track and which ones need a closer look, turning simple numbers into actionable insights.
| Category | Budgeted Amount | Actual Amount | Variance ($) | Variance (%) |
|---|---|---|---|---|
| Groceries | $400 | $475 | -$75 | -18.8% |
| Dining Out | $200 | $260 | -$60 | -30.0% |
| Transport | $150 | $130 | +$20 | 13.3% |
| Hobbies | $100 | $170 | -$70 | -70.0% |
What this tells Alex:
Right away, two problem areas jump out. The 30% overspend on “Dining Out” shows that social spending crept up more than expected. But the real surprise is the massive 70% overage on “Hobbies,” which was almost certainly driven by a few unplanned purchases. The small win in “Transport” is nice, but it’s not nearly enough to cover the other leaks in the budget.
Armed with this data, Alex can make a concrete plan. The new rule? A specific weekly limit for eating out and a “wish list” for hobby stuff to cool off before buying. This single-month report provides the immediate feedback needed to tweak habits for May.
Scenario 2: The Year-to-Date Review for a Family #
Now let’s look at a family saving for a down payment on a house. For them, a single month isn’t enough—they need to see the bigger picture to make sure they’re on track for their long-term goal. A year-to-date (YTD) report is the perfect tool for this.
Six months into the year, here’s their progress:
- Total Savings Goal (YTD): $12,000 ($2,000/month)
- Actual Savings (YTD): $9,500
- Variance: -$2,500 (Unfavorable)
- Key Expense Overruns: A quick look shows their “Vacation” and “Home Goods” categories have a combined unfavorable variance of $3,000.
What this tells them:
That $2,500 shortfall is a major red flag. When they dig in, they see that while most of their budget is fine, two specific categories are derailing their dream of homeownership. This isn’t about pointing fingers; it’s about getting everyone on the same page. The solution? They agree to hit pause on non-essential home goods and plan a more wallet-friendly staycation for their next trip.
This longer-term view helps separate one-off bad months from persistent habits that threaten your most important financial goals. It’s about seeing the forest, not just the trees.
Scenario 3: Navigating Joint Accounts and Multiple Currencies #
Managing money as a team can get tricky, and it gets even more complicated for expats juggling different currencies. In both cases, a clear budget vs actual process is absolutely crucial.
Think about a couple using a joint account for shared bills. If their “Utilities” budget is consistently over by 15%, the report gives them a neutral starting point for a conversation. It becomes about looking at usage together, not arguing about who’s to blame. This same dynamic plays out on a massive scale with governments. Data on EU government expenditure from Eurostat reveals a constant tug-of-war between planned budgets and real-world costs. Just as governments have to manage unexpected expenses, families often find their actual spending on shared bills runs 15-25% over budget.
For an expat earning in USD but spending in EUR, this analysis is non-negotiable for handling currency swings. They might budget €500 for groceries, but what that costs in USD changes every month. By tracking both currencies, they can instantly see if a budget overrun is because they bought too much truffle oil or because the exchange rate tanked. This insight tells them whether they need to cut back on spending or adjust their budget to reflect the new reality.
Using Econumo for Your Budget vs Actual Analysis #
Theory is one thing, but putting budget vs actual analysis into practice day after day is what truly matters. You need the right tool for the job. While you can definitely wrestle with spreadsheets, a dedicated app like Econumo is designed to make the whole process feel less like a chore and more like a simple, mindful habit.
What makes Econumo different is its focus on manual transaction entry. This isn’t a missing feature; it’s the core philosophy. Instead of transactions passively syncing in the background, you actively log every purchase. This small act keeps you constantly engaged with your spending and ensures your data is spot-on from the get-go.
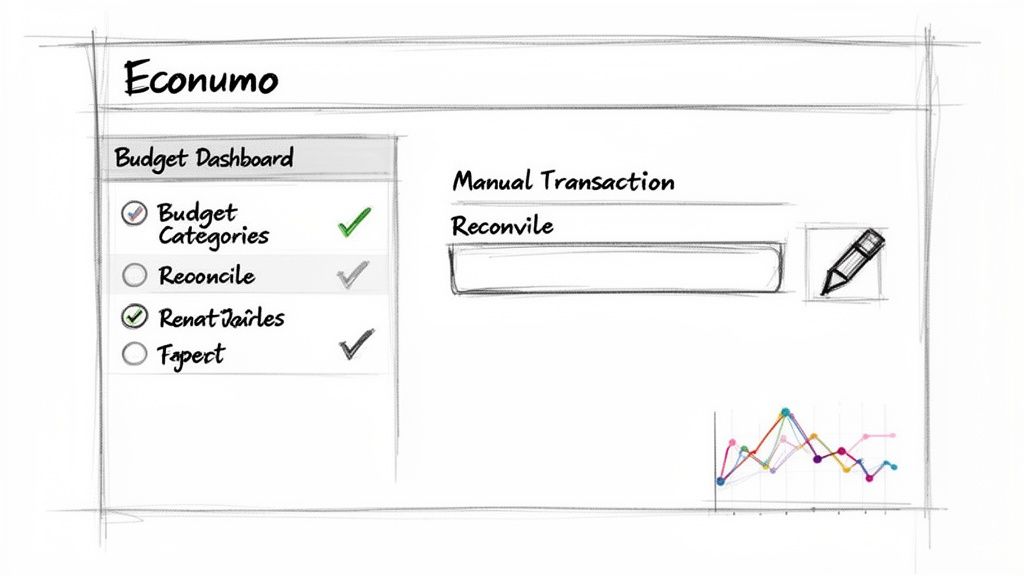
Setting Up Your Financial Foundation #
To get started, you’ll want to build a framework in Econumo that genuinely reflects your financial life. The idea is to make the system so intuitive that tracking your budget vs actual becomes second nature, whether you’re flying solo or managing finances with a partner.
- Create Your Budgets: Start by setting up budget categories that actually mean something to you. Don’t just settle for a generic “Food” bucket. Break it down into “Groceries,” “Dining Out,” and “Coffee Shops.” This level of detail is where the real insights are hiding.
- Enter Transactions Manually: Make this a quick daily or weekly habit. It only takes a few minutes, but that hands-on approach creates a powerful feedback loop. You become much more conscious of your spending decisions in the moment.
- Reconcile Your Accounts: Every so often, sit down and match your Econumo entries against your bank statements. This is a crucial step to catch anything you might have missed and guarantees your analysis is built on 100% accurate data. No more guesswork.
The simple act of manually entering each transaction turns budgeting from a passive report into an active, mindful exercise. It forces you to look at every dollar you spend, making you naturally more accountable to your own plan.
Once you have this routine down, Econumo’s visual tools start to really shine. For a deep dive into the setup process, you can check out our guide on how to create and manage your budgets.
Visualizing Variances with Dashboards #
With your data flowing in, Econumo’s dashboards bring your budget vs actual analysis to life. Forget about manually calculating variances or scanning endless rows of numbers to figure out what’s going on.
The main dashboard gives you a clean, at-a-glance overview of your financial health. You can see in seconds which categories are on track and which ones are flashing a warning sign. This visual clarity is what helps you spot potential problems early and keeps you motivated to stick with it.
Here’s a snapshot of what the dashboard looks like, with a clear breakdown of spending categories against their budgets.
This report immediately shows that “Shopping” and “Entertainment” are over budget, while “Food” is still in the green. Just like that, you know exactly where to focus your attention.
Collaborative Budgeting for Households #
Econumo was also built with couples and families in mind. It simplifies managing shared finances without forcing you to give up your privacy or creating confusion. When you’re tackling a budget vs actual analysis together, transparency is everything.
- Joint Accounts and Shared Budgets: You can easily set up shared budgets tied to joint accounts for things like rent, utilities, or that family vacation you’re saving for.
- Multi-User Access: Each person gets their own login. You can contribute to the shared financial picture while still keeping personal accounts completely separate, if that’s what you prefer.
- Clear Accountability: When a variance pops up in a shared category, the data gives you a neutral place to start the conversation. It’s no longer about, “You spent too much,” but instead becomes, “Looks like we’re over on groceries this month. Let’s figure out why together.”
This approach takes the emotion out of money talks. By focusing on the numbers right there in Econumo, you and your partner can operate as a team to adjust your plan, celebrate your wins, and build a stronger financial future. It turns your budget vs actual analysis into a tool for getting on the same page, not for finding someone to blame.
Building a Sustainable Budgeting Habit #
Turning your budget vs. actual analysis from a one-time chore into a powerful, lifelong habit is where you gain real financial control. It’s not just about tracking numbers; it’s about building a sustainable routine that empowers you and genuinely reduces stress.
Consistency is everything. By setting up a regular review cadence, you turn what could be an overwhelming annual task into a simple, manageable check-in. This rhythm keeps you connected to your finances without letting them take over your life.
Finding Your Rhythm #
The key is to create two distinct touchpoints for your financial review.
Weekly Check-Ins: This is your quick, five-minute sanity check. Just open up Econumo, log any new transactions, and take a quick look at how your category spending is tracking. The goal here is just to stay current and prevent a mountain of work from piling up.
Monthly Deep Dives: At the end of each month, set aside about 30 minutes. This is when you’ll sit down, reconcile your accounts, and really dig into your budget vs. actual variances. Talk about what went well and what might need a tweak for the upcoming month.
If you’re managing money with a partner, these meetings need to be a judgment-free zone. The numbers aren’t a weapon for blame; they’re a neutral starting point for a team conversation. We cover more on this in our guide on how to stick to a budget.
Make Your Budget Resilient #
A budget that shatters the first time life throws you a curveball isn’t a good budget. You need to build in some resilience. Creating a “Miscellaneous” or “Contingency” fund is a brilliant way to give yourself flexibility for those unexpected costs that always seem to pop up, without derailing your whole plan.
Your budget vs. actual analysis is a learning tool. Each variance, whether it’s favorable or unfavorable, offers a lesson that helps you refine your plan over time, making it smarter and more aligned with your real life.
To make this routine stick, you might find it helpful to use tools that reinforce your consistency. Exploring the best habit tracking apps can be a great way to keep yourself on track.
Ultimately, a tool like Econumo is designed to support this journey by emphasizing manual control and mindful engagement. By actively participating in your financial tracking, you’re not just crunching numbers—you’re building a deeper awareness and a sustainable habit that paves the way for long-term financial success.
Common Questions About Budget vs Actual Analysis #
As you start weaving budget vs actual analysis into your financial life, you’re bound to run into a few questions. Let’s tackle some of the most common ones that pop up when you’re getting started.
How Often Should I Do a Budget vs Actual Review? #
Finding the right rhythm is everything. I’ve found a two-part approach works best for most people without becoming a chore.
Try a quick weekly check-in—just 5-10 minutes to make sure all your spending is logged. Then, at the end of the month, set aside 20-30 minutes for a deeper monthly review. This is where you’ll dig into the numbers, figure out what happened, and make a game plan for the next month. This way, you stay on top of things without feeling overwhelmed.
What if My Income Is Irregular? #
If your income bounces around, this kind of analysis is even more important, not less. The trick is to stop thinking in fixed monthly terms. Instead, build your budget around a conservative estimate—maybe your lowest earning month or a careful average.
When you have a great month, your budget vs actual report will show you a clear positive variance. You’ll know exactly how much extra cash you have to throw at savings, debt, or a “rainy day” fund. When a slow month hits, the negative variance isn’t a surprise; it’s a number that tells you precisely how much you need to pull from that fund to cover your costs.
What’s an Acceptable Variance? #
This is a classic question, and the honest answer is: it depends. A 5% overspend on your rent is a huge red flag. But going over your “Coffee Shops” budget by 20%? That might just be a busy week and not worth stressing over.
The real insight comes from looking at the trend over time, not a single month’s number. As a rule of thumb, if you’re consistently over budget by more than 10% in the same category for three months straight, something needs to give. Either your budget for that item is unrealistic, or it’s time to look at changing a habit.
Should I Adjust My Budget Mid-Month? #
My advice is to generally avoid this. If you’re constantly tweaking your budget in the middle of the month, it starts to feel like you’re just moving the goalposts to make yourself feel better. It kind of defeats the purpose of holding yourself accountable. Let the month play out, then analyze the results with a clear head.
The big exception, of course, is for a major, unplanned event—a sudden car repair, an emergency vet visit, you know the drill. Life happens. In that case, absolutely adjust the budget to deal with the new reality. Your budget is supposed to be a helpful tool, not a straitjacket. Your end-of-month analysis will then clearly show how that one-time event impacted everything else.
Take the guesswork out of your financial planning. Econumo provides the clear dashboards and collaborative tools you need to turn your budget vs actual analysis into a simple, powerful habit. Start your journey toward financial clarity today.